Category Archives: How-to & Tips
How-to & Tips4 Mins
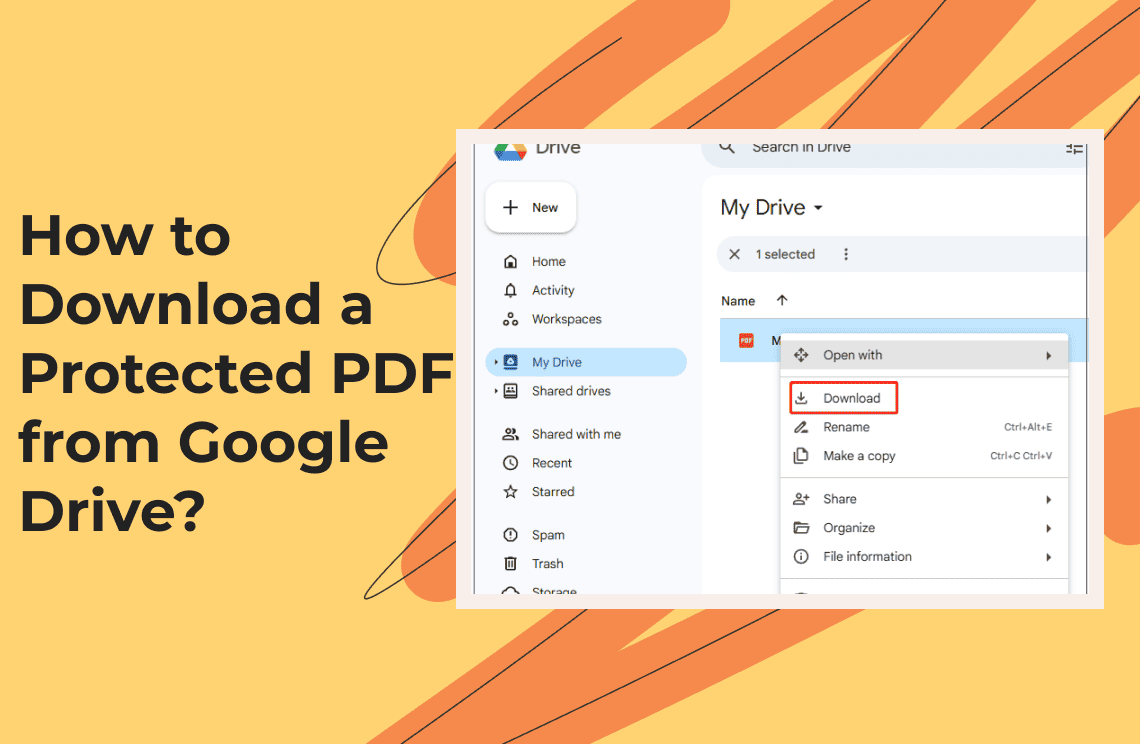
How to Download a Protected PDF from Google Drive?
Learn ethical and legitimate methods to download protected PDFs from Google Drive. Understand permissions, printing workarounds, and mobile app features.
Read More >>
How-to & Tips4 Mins
How to Fix Windows 10/11 Desktop Icons Missing After Restarting?
Desktop icons missing after Windows restart? This guide offers 6 effective ways to restore them on Windows 10/11. Get your icons back now!
Read More >>

How-to & Tips4 Mins
How to Play Sheet Music from PDF? (Step by Step)
Play sheet music from PDF easily! Step-by-step guide to obtaining, importing, and using digital scores with apps like forScore & MuseScore.
Read More >>
How-to & Tips3 Mins
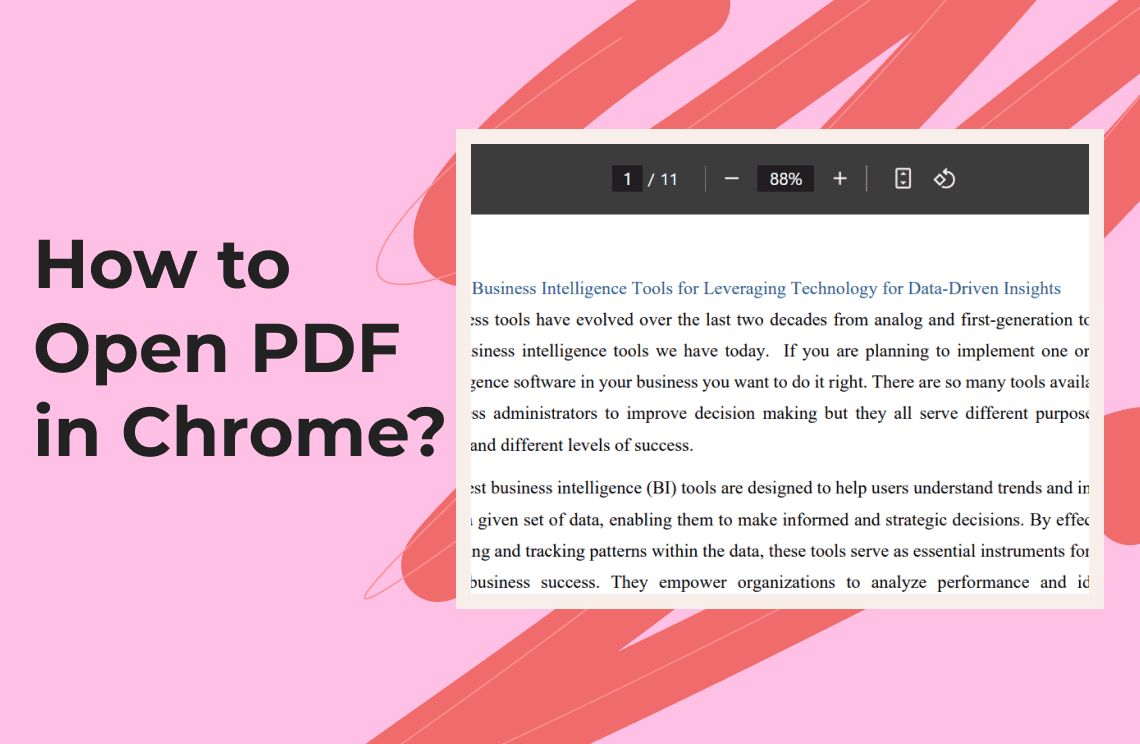
How to Open PDF in Chrome? The Complete Guide
Open PDFs in Chrome easily! Learn how to set Chrome as default on Windows & Mac, troubleshoot viewing issues, and view on mobile.
Read More >>
How-to & Tips4 Mins
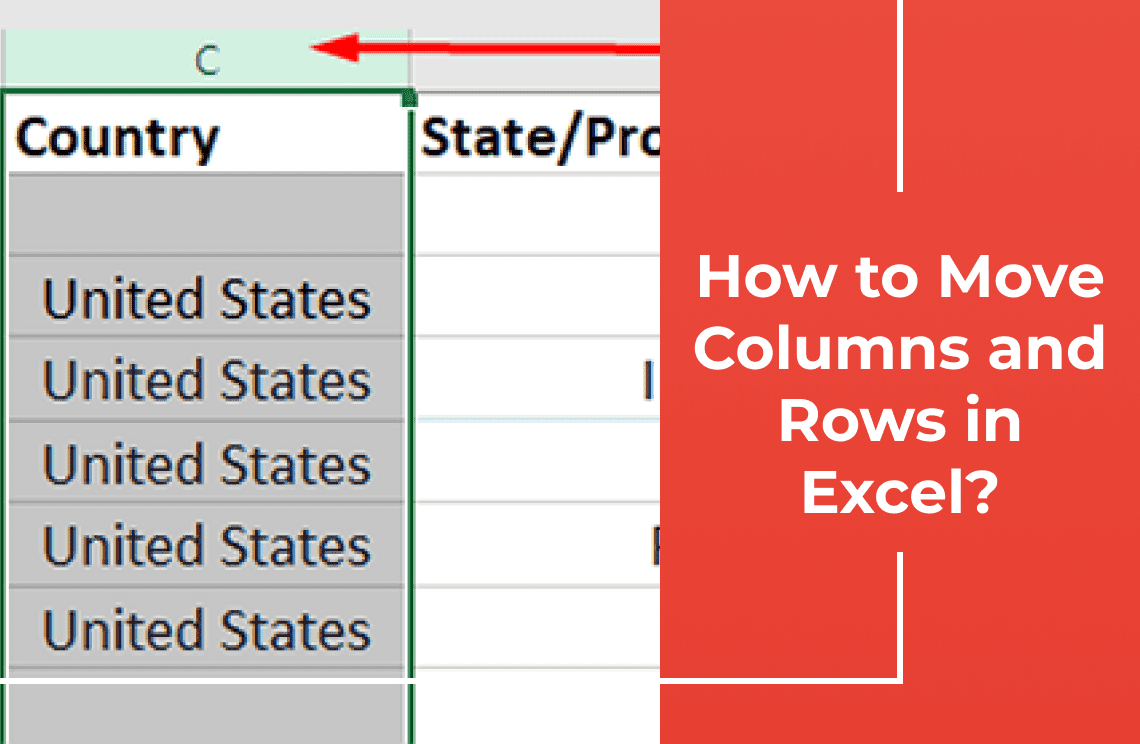
How to Move Columns and Rows in Excel?
Learn 3 easy methods to move columns and rows in Excel: drag & drop, Shift key, and cut/insert. Organize data efficiently and maintain integrity.
Read More >>
How-to & Tips4 Mins
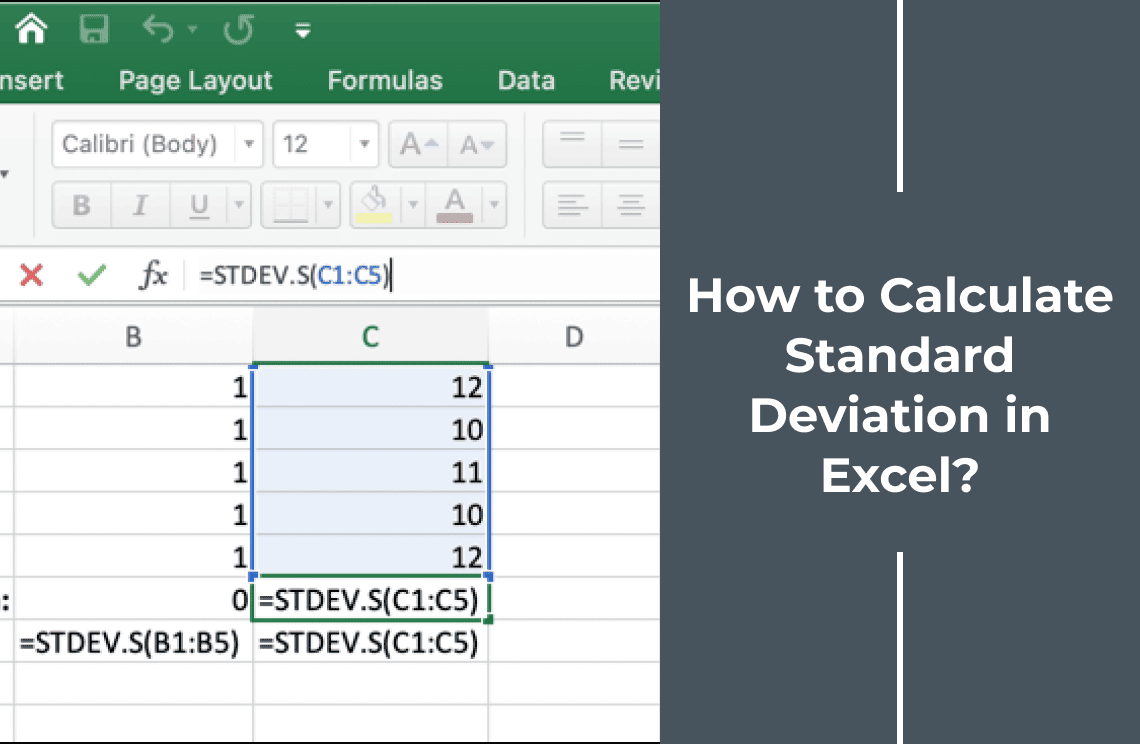
How to Calculate Standard Deviation in Excel?
Calculate standard deviation in Excel easily! Learn STDEV.S & STDEV.P, interpret results, and add error bars to charts. Understand data variability now.
Read More >>

How-to & Tips5 Mins
How to Use VLOOKUP in Excel Effortlessly?
Master Excel's VLOOKUP! Learn to retrieve data efficiently across sheets and workbooks. This guide covers syntax, troubleshooting, and practical examples.
Read More >>